Reporting & Analytics
Lite+See what’s in the pipeline, how the team is performing, and whether you’re hitting your targets.
When to use
Use Reporting & Analytics any time you need a view across the data — not a single record. The module covers:
- Live dashboards for the things you watch daily (sales pipeline, job manager).
- Operational reports with date / rep / category / branch filters.
- Sales targets and forecasts.
- Quality and timeliness metrics like IFOTIS.
- Labour and leave tracking.
Everything either renders inline or exports to PDF / Excel.
Overview
Three places to find reporting:
- Dashboards — interactive, kanban-style or grid views, refreshed live as data changes (Sales Pipeline, Job Manager).
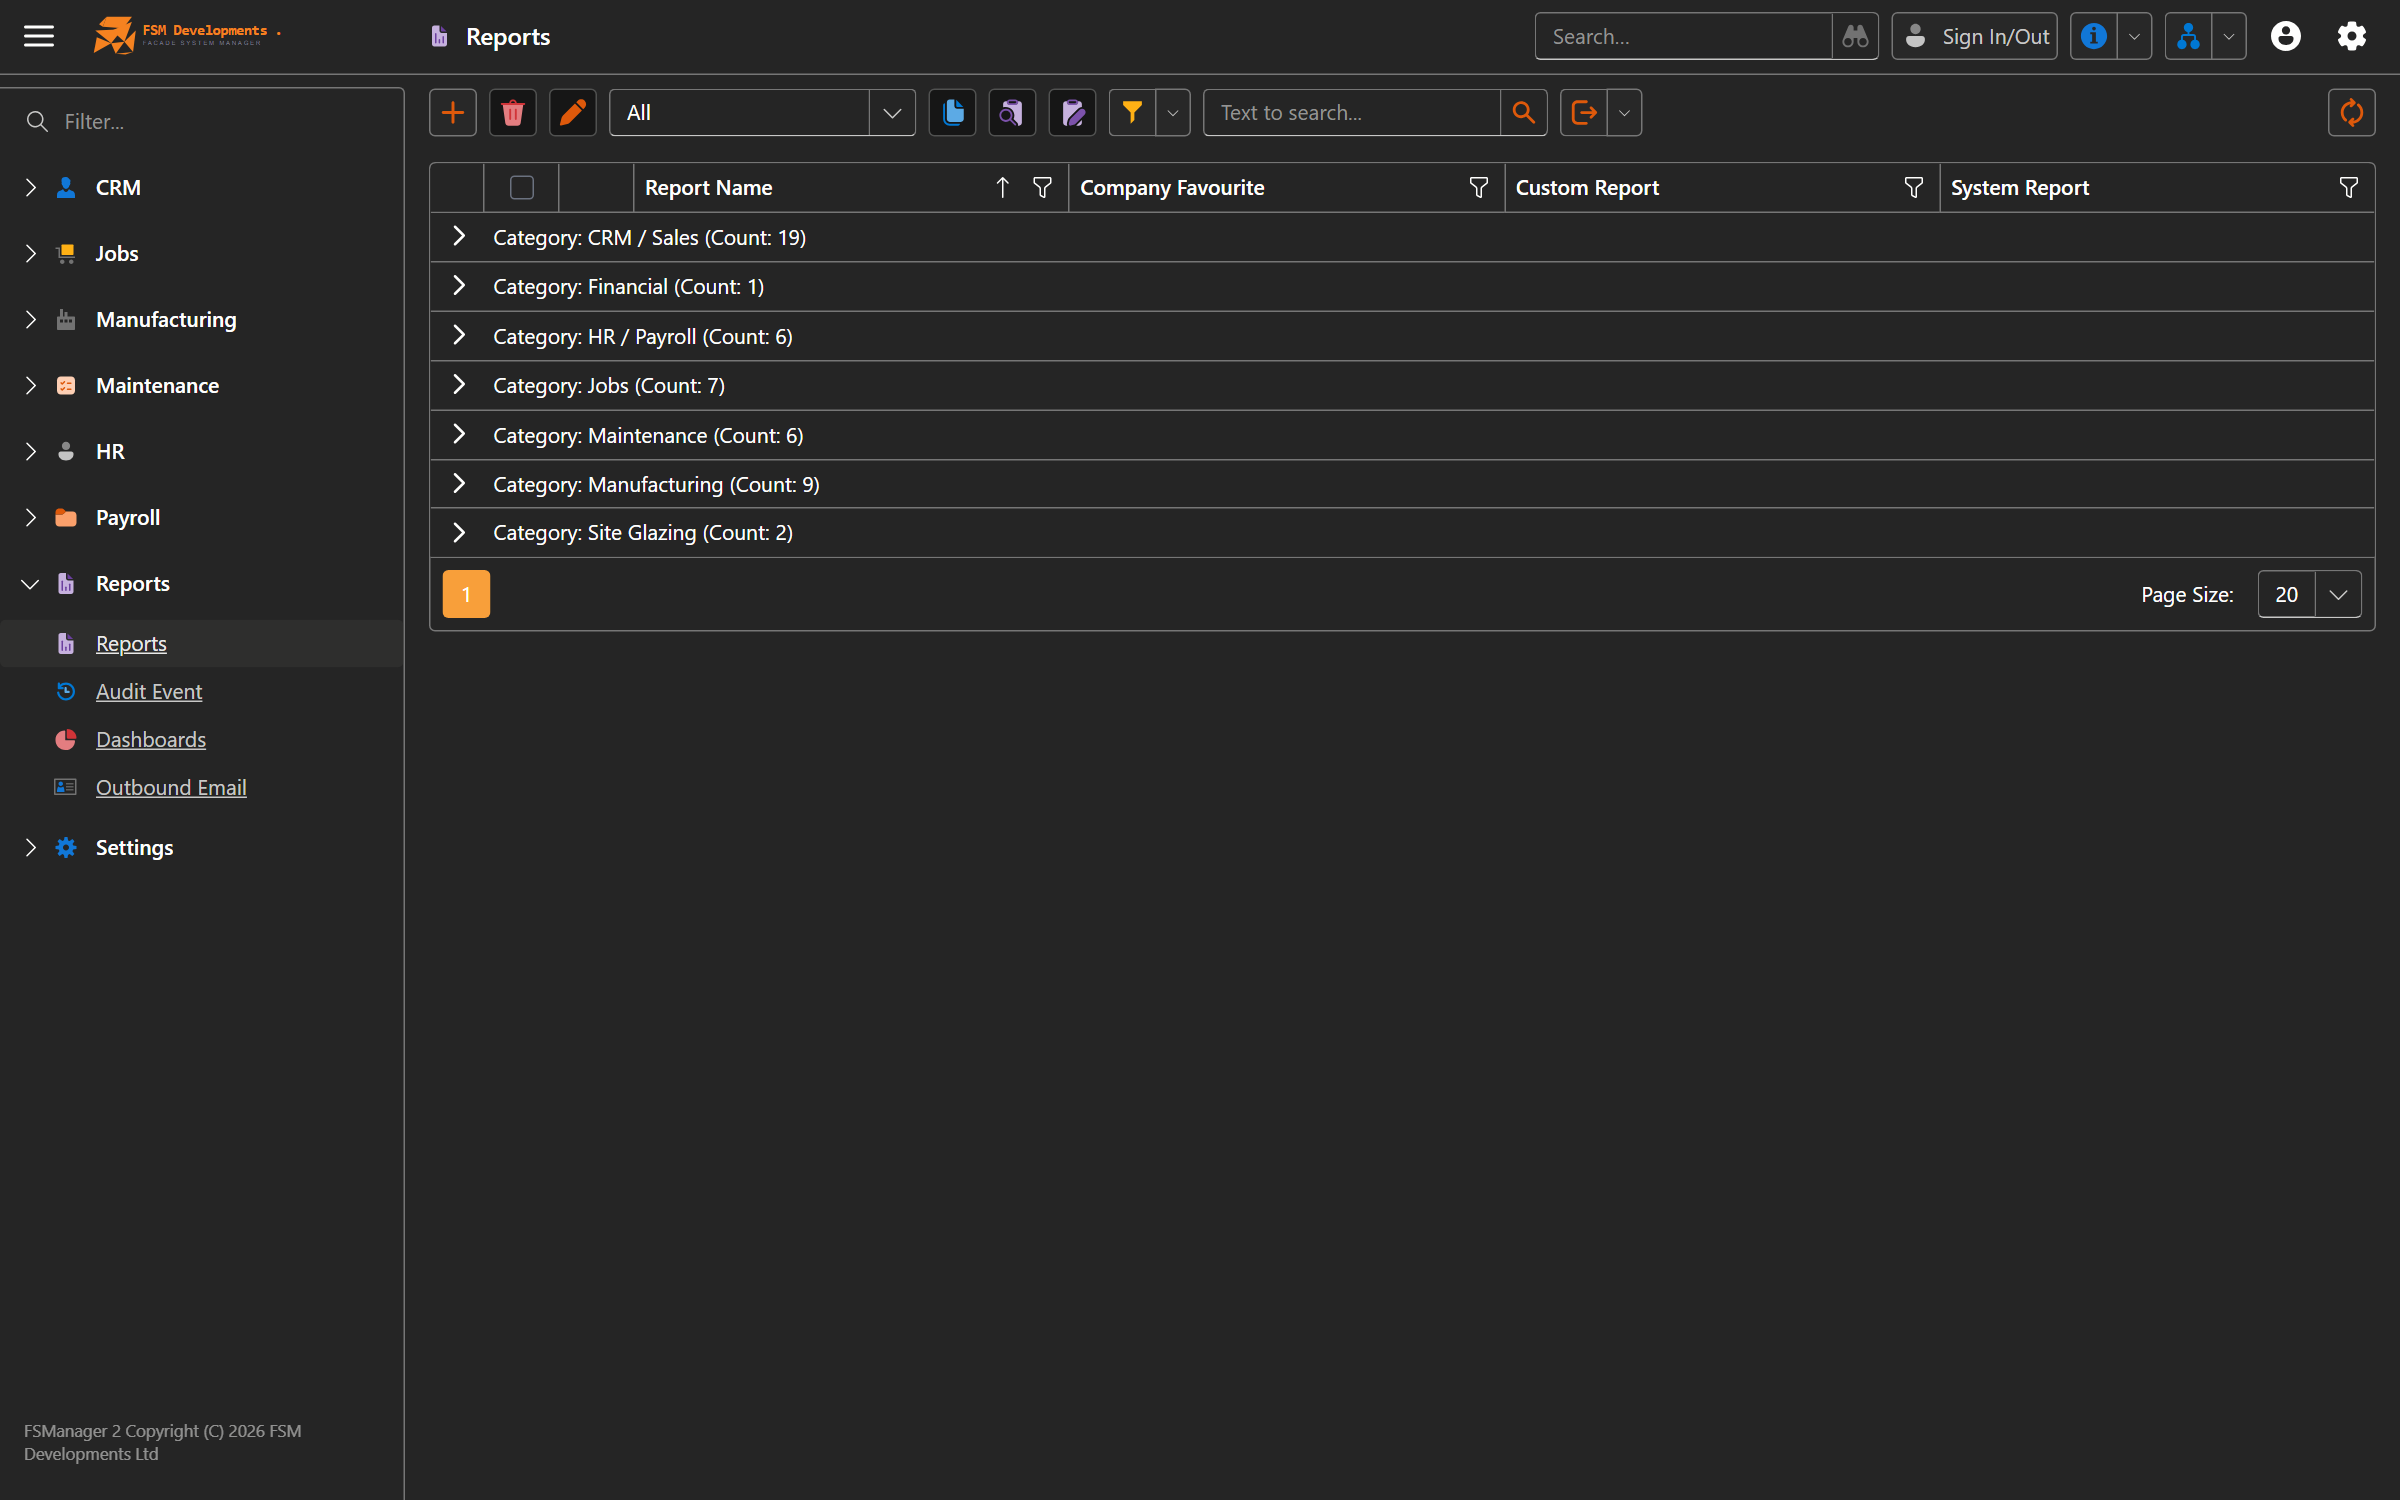
- Reports list — under Reports in the main menu, a searchable list of every parametrized report. Pick filters, run.
- Sales Targets — under CRM → Sales Targets, an editable matrix of rep × category × month.
Key features
Sales Pipeline (Dashboard)
A kanban board of open opportunities grouped by their display stage (New → Qualifying → Estimating → Draft → Sent). Each card shows the title, customer, sales rep, Reporting Value (the primary quote’s active revision price), and the probability-weighted forecast.
Filter by sales rep, branch, or category. Click any card to open the opportunity.
Access: CRM → Sales Pipeline.
Job Manager (Dashboard)
Every active job as a row, with one column per task display abbreviation (e.g. MFGD, PWDC, GLZE). Each cell shows the task’s completion percentage with a colour code. Sort and filter by stage, due date, branch, or overdue flag.
Access: Jobs → Job Manager.
Estimator Performance (Dashboard)
A view of estimating throughput per estimator. Driven by Estimation Completed On (the explicit “I’m done estimating” timestamp, not when the quote was sent). Shows quotes-per-week, on-time vs late vs overdue, average duration.
Access: Reports → Dashboards → Estimator Performance.
Maintenance dashboard
Open maintenance requests by status, chargeability, and assignment.
Access: Reports → Dashboards → Maintenance.
Reports list
The full inventory of parametrized reports. Categories include:
Sales (10 reports)
- Open Opportunities — active pipeline by rep / category / branch.
- Expired Opportunities — past Sales Date, no closure.
- Open / Expired Quotes — quote-level visibility with revision status.
- Quotes Requiring Follow-Up — flagged by follow-up date.
- Quote Performance — win/loss rates by category, source, region.
- Customer Quote Performance — per-customer batting average.
- Opportunity Conversion — funnel from New → Qualifying → Quoting → Won.
- Lost Opportunities By Reason — histogram of why deals were lost.
- Opportunities By Source / Region — pipeline segmentation.
- Won Quotes — closed/won deals over a date range.
Sales vs Target & Forecasting
- Sales vs Target — actual won value vs target, by rep × category × month. Unplanned wins (categories with no target) shown in italics.
- Pipeline Forecast — open opportunities bucketed by probability, with a grand-total weighted forecast.
Jobs
- Site Measure Summary — printable measurement record.
- Site Measures To-Do — outstanding site measures.
Maintenance (9 reports)
- Open requests, requests to invoice, chargeable by date, historical complete, by reason, by assignee, printable site form, dashboard.
Labour & HR (5 reports)
- Staff Timeclock — actual hours per employee per day.
- Staff Timeclock — Late — late arrivals / early departures.
- Staff Timeclock — Specific — custom employee + date range.
- Staff Claims — personal expense claims (mileage, materials).
- Approved Leave — leave taken in a date range.
Each report shows a parameter prompt before running. Output renders to PDF and can be exported to Excel.
Sales Targets
Effective-dated targets per Employee × Job Category × Month:
- Open CRM → Sales Targets.
- The matrix shows each sales rep down one axis and job categories across the other. Pick the month with the date picker.
- Type a target into a cell. The target rolls forward each month until you supersede it with a new target.
- Run Sales vs Target to see actuals against targets.
Pipeline Forecast
Buckets open opportunities by their Probability % (e.g. 90%, 50%, 20%). For each bucket: opportunity count, total Reporting Value, probability-weighted contribution. Grand total is your expected-value forecast for the period.
IFOTIS (job quality)
In Full, On Time, In Spec is computed per JobPart when the part reaches a terminal stage with an Actual Delivery Date. See Job Management → IFOTIS for how the three flags resolve. Aggregating IFOTIS across jobs is on the roadmap; for now the records exist on each JobPart and can be filtered in the JobPartIFOTIS list view.
Favourites and customisation
- My Favourites — tick a report’s favourite flag to add it to your personal short-list. Toggle the Reports list view to My Favourites to focus on what you actually run.
- Company Favourites — admins can flag reports as company-wide defaults so they show at the top of the list for everyone.
- Categories — admins maintain a
Report Categorylist to organise reports into sections.
How to: open the Sales Pipeline
- Main menu → CRM → Sales Pipeline.
- The kanban loads with one column per display stage.
- Use the filter bar (rep, branch, category) to narrow the view.
- Click any card to open that opportunity in a new tab.
How to: run a report
- Main menu → Reports.
- (Optional) Switch the view filter to My Favourites or Company Favourites.
- Click the report you want.
- The parameter prompt appears — set Date From / To, Sales Reps, Categories, Branches, etc. as available.
- Click OK. The report renders inline.
- Export to PDF or Excel using the toolbar.
How to: set sales targets for the year
- Main menu → CRM → Sales Targets.
- Set the date picker to the first month of the year.
- For each sales rep × category, type the monthly target.
- Save. Targets roll forward — set a new target later in the year to supersede.
- Run Sales vs Target to track progress.
How to: favourite a report
- Open Reports.
- Find the report you run regularly.
- Tick the Favourite column (or open the report’s detail and toggle the flag).
- Switch the view to My Favourites — it appears.
How to: see who’s overdue on follow-ups
- Reports → Quotes Requiring Follow-Up.
- Set the date range (e.g. today).
- Group by sales rep, export to share.
Alternatively, from CRM → Sales Pipeline, filter to Overdue — opportunities where Sales Date ≤ today glow as the priority.
Tips & gotchas
- Reporting Value can be null. It’s
nulluntil an opportunity has a primary quote with an active revision. New opportunities — and opportunities still in the prospect stage — won’t show a value in pipeline reports. - Weighted Value depends on Probability. A 100% probability and a 0% probability both contribute differently — set Probability honestly so the forecast means something.
- Sales Date is the follow-up calendar. Reports like Expired Opportunities and Quotes Requiring Follow-Up lean on it. Keep it accurate or the reports lose their teeth.
- Sales vs Target shows unplanned wins. Wins in a category with no target set appear in italics. That’s intentional — they count as revenue, but they also tell you you’ve got an untracked product line.
- IFOTIS counts customer-caused changes correctly. A delivery date change with a reason flagged Affects On-Time = false doesn’t break the On-Time flag. Make sure your Delivery Date Change Reasons list distinguishes customer-caused from internal-caused.
- Estimator Performance uses
Estimation Completed On, notSent On. The gap between those two (“estimator finished, sales rep sat on it”) doesn’t count against the estimator. - The Reports list has no built-in sharing. If you build a custom report, anyone with access to the Reports list will see it; favouriting is per-user.
Related
- CRM — the data source for every sales report; Sales Pipeline kanban lives here
- Job Management — Job Manager dashboard, IFOTIS, delivery performance
- Time Recording — the data behind the Staff Timeclock and Claims reports
- Administration → Settings — Report Categories, Sales Target setup, Delivery Date Change Reasons